Over spring break, our geography seminar class was graced with amazing weather. At the time, there was a crazy trough in the jet stream that was positioned over the center of the country. This brought cold conditions to the western regions and warm, pleasant conditions to the eastern regions. While in New York City, our group enjoyed weather in the high 70s while states like Nevada experienced weather in the high 40s. Here's a picture I managed to snap in prospect park.

Exploring Clouds from Above the Cloud Layer (mostly cumulus humilis)

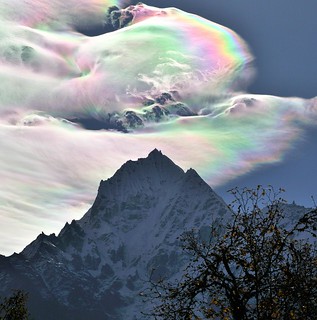
Analyzing Clouds Like a Boss

Assignment 4: Micro-climate Maps
The maps featured below were mere made using data that were manually collected by UWEC students. At each location, students recorded the wind speed, wind direction, temperature and dew point. There are some outliers in this map, though. For example, you'll notice particular areas where temperatures are far greater than the norm. This is because students collected these temperatures near heating vents. In addition, some buildings blocked the wind, resulting in some recordings of a wind speed of 0 mph. After collecting the data, attributes were assigned to digitized points. Finally, the kriging tool (spatial analyst) was used to create the type of spatial analysis shown below.


Cool Internet Find
Awesome video. If there's ever a solar-induced cyber apocalypse, I'll head north to see the light show.
Assignment 3 Map: Wind Speed and Direction
The map below was based upon wind data that were downloaded from the national weather surface. Next, the data was placed over a shapefile of the continental united states and set to the WGS 84 projection. Finally, the data points were changed to indicate wind direction and strength.

Just something to ponder while we enjoy this mild winter.
F-4 tornadoes in February.
No comments:
Post a Comment